Supplementary Materials for Unifying Image Quality Assessment Datasets
User Interface for the subjective test
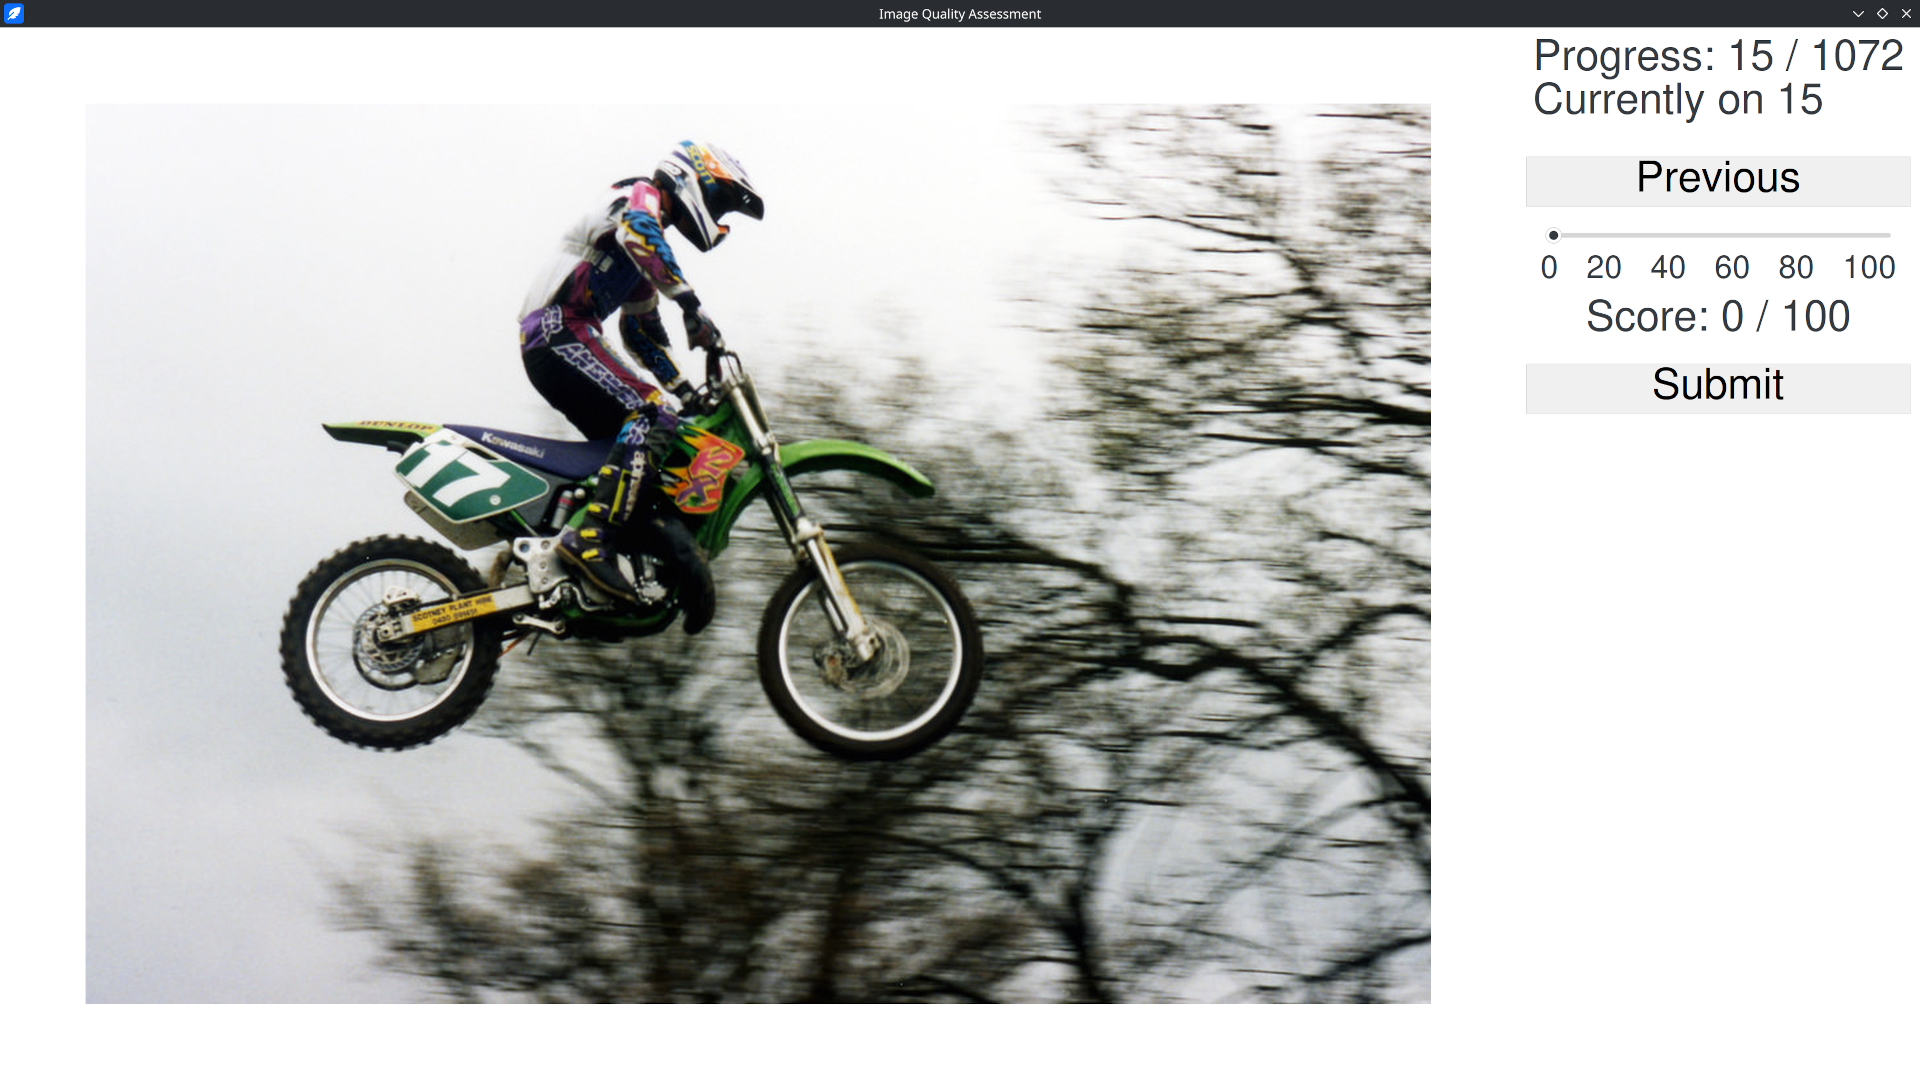
- One image is shown to a subject at a time (without showing the reference)
- A subject is asked to rate the quality of the image on a scale from 0 to 100, either by dragging the slider or by typing the score on keyboard.
- A subject may modify the score of the last image by clicking the “Previous” button.
Incorporating Image Features During Score Mapping
One may ask whether
As shown in the table below,
| Method | AVA | CID | CSIQ | KADID | KonIQ | LIVE | CLIVE | LIVE-MD | SPAQ | TID08 | TID13 | Mean |
|---|---|---|---|---|---|---|---|---|---|---|---|---|
| Selected | .731 | .766 | .848 | .317 | .919 | .823 | .721 | .893 | .924 | .866 | .449 | .751 |
| Logistic 4 | .732 | .758 | .832 | .320 | .920 | .820 | .734 | .885 | .927 | .856 | .323 | .737 |
| Logistic 5 | .730 | .758 | .829 | .284 | .918 | .821 | .736 | .903 | .927 | .880 | .327 | .737 |
| CDF Matching | .783 | .792 | .806 | .138 | .934 | .784 | .717 | .901 | .922 | .826 | .375 | .725 |
| Selected + |
.841 | .855 | .915 | .447 | .920 | .862 | .863 | .876 | .906 | .821 | .491 | .800 |